Tweet

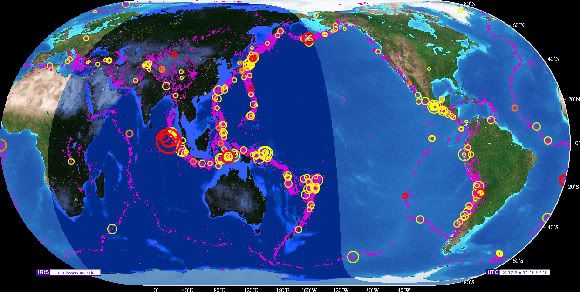
Click on the image above to visit the Incorporated Research Institutions for Seismology iris.edu real time seismic monitor. Each circle represents an earthquake. The bigger the circle, the stronger the quake. Hover your mouse cursor over a circle to see the magnitude, time, and location of the quake. Note the color code key at the top left of the map. The color of the circle indicates how long ago the quake occurred. Distinct colors represent earthquakes that happened today, yesterday, within the past two weeks, and within the past five years.
Tweet

No comments:
Post a Comment